Introduction
Quantifying Evolving Risk and Identifying Effective Policy Actions for a Resilient Future
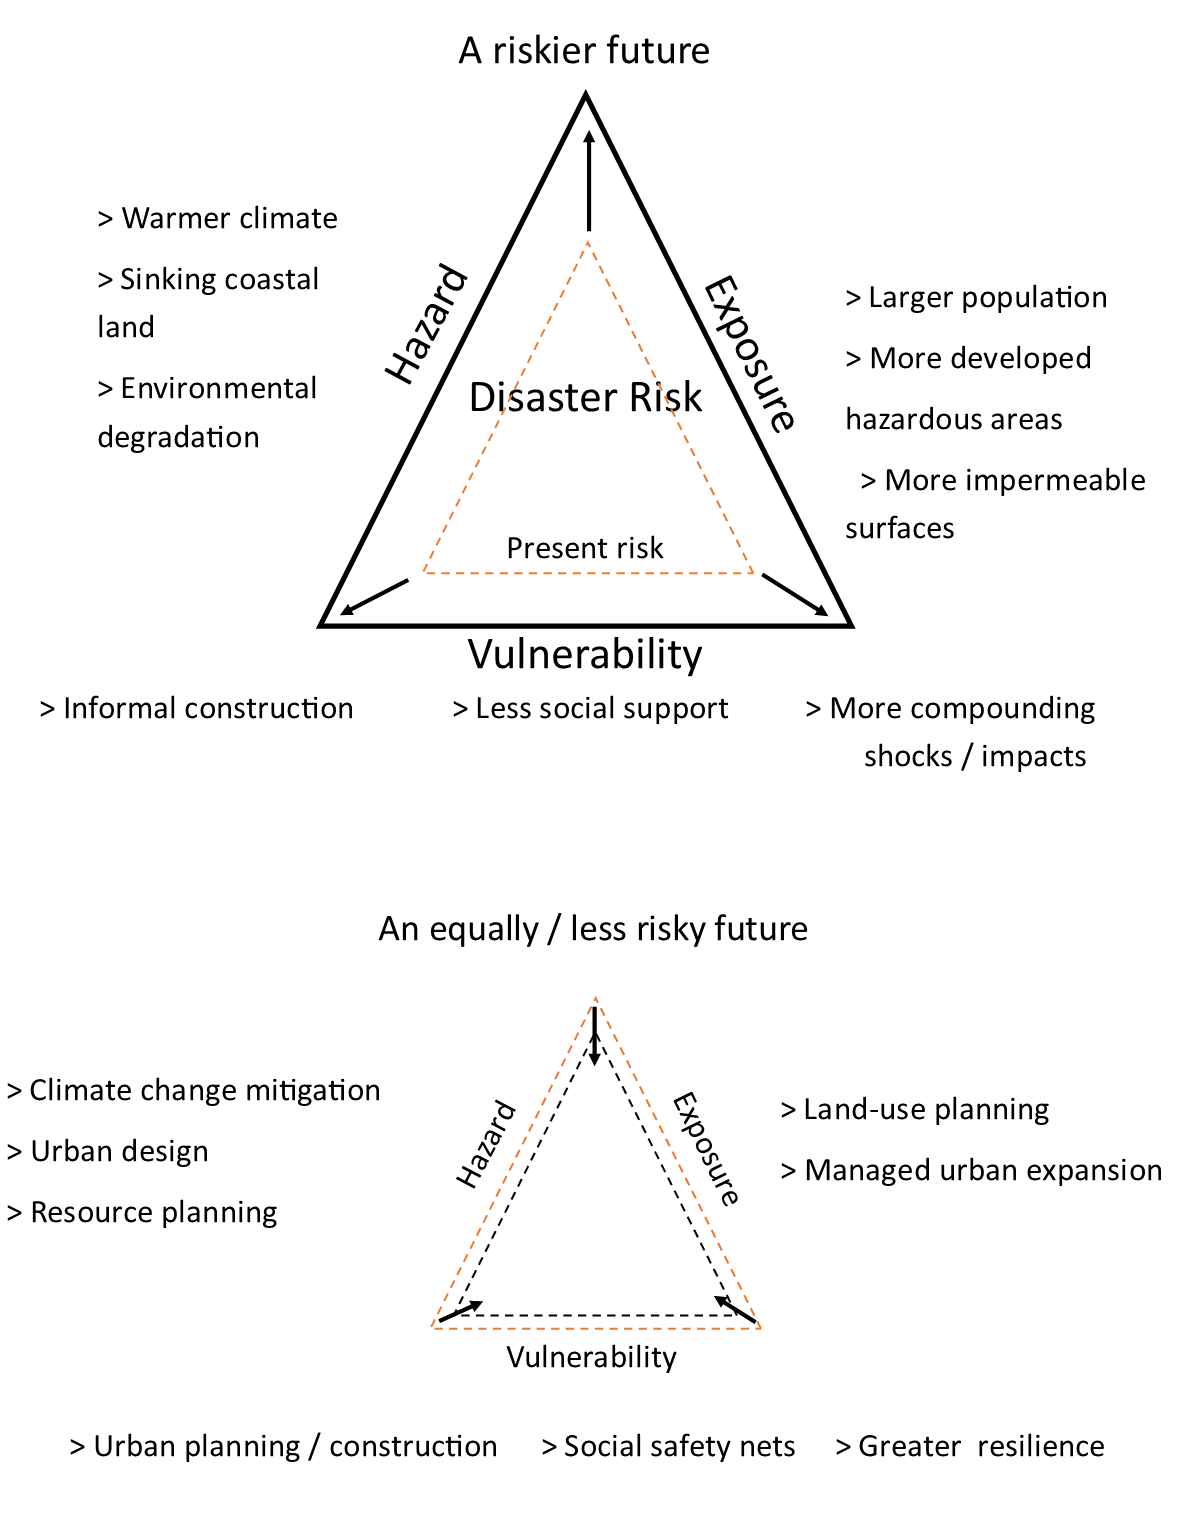
Disaster risk is rapidly increasing due to changes in its underlying components: hazard, exposure, and vulnerability. Disaster risk evolves spatially and temporally as a result of changes to one or more of these three components, and the inherent interactions between them – changes to one component can influence the other components. Disaster risk can be influenced by climate, development, and risk management (Figure 1). Over time, disaster risk may increase or decrease, and it may evolve differently at the local, regional, national, and global scales. Risk rarely evolves uniformly in a community or region; it often increases most with respect to particular types of assets, or for sectors of the population with greatest vulnerability.
Key Messages
- Most disaster risk assessment today is static, focusing only on understanding current risks. A paradigm shift is needed toward dynamic risk assessments, which reveal the drivers of risk and the effectiveness of policies focused on reducing risk.
- Global disaster risk is changing extremely fast, due to combined dynamics of hazard, exposure, and vulnerability.
- The drivers of disaster risk are in the control of policy makers, society, and individuals—but accurate assessment and continuous reevaluation of risk is required to enable effective risk reduction and prevent drastic increases in future losses.
Components of Risk
Hazard refers to the likelihood and intensity of a potentially destructive natural phenomenon, such as ground shaking induced by an earthquake or wind speed associated with a cyclone. Climate change and climate variability contribute to the evolution of hazard by altering the frequency, intensity, seasonality, and geographic coverage of these phenomena.
Exposure refers to the location, attributes, and value of important community assets that are exposed to the hazard, such as people, buildings, agricultural land, and infrastructure. Population growth, urbanization, and socioeconomic development drive the evolution of exposure, and have been the primary driver of disaster losses in recent decades.
Vulnerability is the potential extent to which physical, social, economic, and environmental assets may become damaged or disrupted when exposed to a hazard event. Physical vulnerability refers to the level of damage sustained by built structures due to the physical load imparted by a hazard event. Socioeconomic or social vulnerability refers to factors such as livelihood, social connections, and gender, which influence a community’s ability to respond to, cope with, and recover from a disaster. Vulnerability can affect the number of casualties, the loss or disruption sustained, and the community’s subsequent recovery time. Socioeconomic development, unplanned urban development, unsafe building practices, the occurrence of disasters themselves, and the efficacy of post-disaster recovery all affect vulnerability.
“Risk assessments need to account for temporal and spatial changes in hazard, exposure, and vulnerability, particularly in rapidly urbanizing areas or where climate change impacts will be felt the most. A risk assessment that provides an estimation of evolving or future risk is a way to engage stakeholders in carrying out actions now in order to avoid or mitigate the risk that is accumulating in their city or country. For example, risk analysis offers an opportunity to quantify the decrease in future risk that arises from better enforcement of building codes, and hence to demonstrate the benefit of spending additional funds on building code enforcement” (216). 1
Past climate change and development have already increased disaster risk, but decisions being taken today can still influence disaster risk in the future—either by reducing risk or increasing it. By promoting actions that reduce risk and avoiding maladaptive actions that increase risk, we can positively influence the risk environment of the future. The drivers of future risk are within the control of decision makers today: there is a huge opportunity today to manage the risks of tomorrow. Key areas in which policies can influence the evolution of disaster risk are climate change mitigation, management of land-use change due to urban expansion and changing socioeconomic activity, construction practices, ecosystem-based risk management, better planning of reconstruction, and targeted data collection to further improve risk modeling.
In order to make effective policy and planning decisions to reduce future risk, present and future risk must be quantified. Disaster risk assessment—vital for understanding risk in terms of expected population affected or losses incurred—underpins disaster risk management (DRM) activities. In making decisions that influence investment in and design of these activities, for the dynamic nature of hazard, exposure, and vulnerability must be accounted for. The ability to compare the two sets of results enables risk management specialists to demonstrate how policy actions taken now and in the near future could affect the risk environment in the medium to long term.
Despite the ability to quantify future risk with available models and tools, risk assessments typically fail to account for changing climate, population, urbanization and environmental conditions. They thus reduce the opportunity to highlight long-term, cost-effective options for risk reduction. Risk assessments most often fail to account for evolution of risk because they use information that represents risk factors at a single time point in the past, and do not include projections of those data into the future.
Drivers of Evolving Disaster Risk: Hazard
“A changing climate leads to changes in the frequency, intensity, spatial extent, duration and timing of extreme weather and climate events, and can result in unprecedented extremes” (111). 2
Climate change is a significant driver of evolving hazard and a major factor in increasing disaster risk. It has been clearly linked to changes in the characteristics of disasters. 2 Research into the mechanisms and risks of changing climate shows that disaster risk has already been influenced by climate change. Other influences on changes in hazard, and hence on disaster risk, include human actions such as extraction of groundwater and certain kinds of land use.
Climate influences on wind hazards
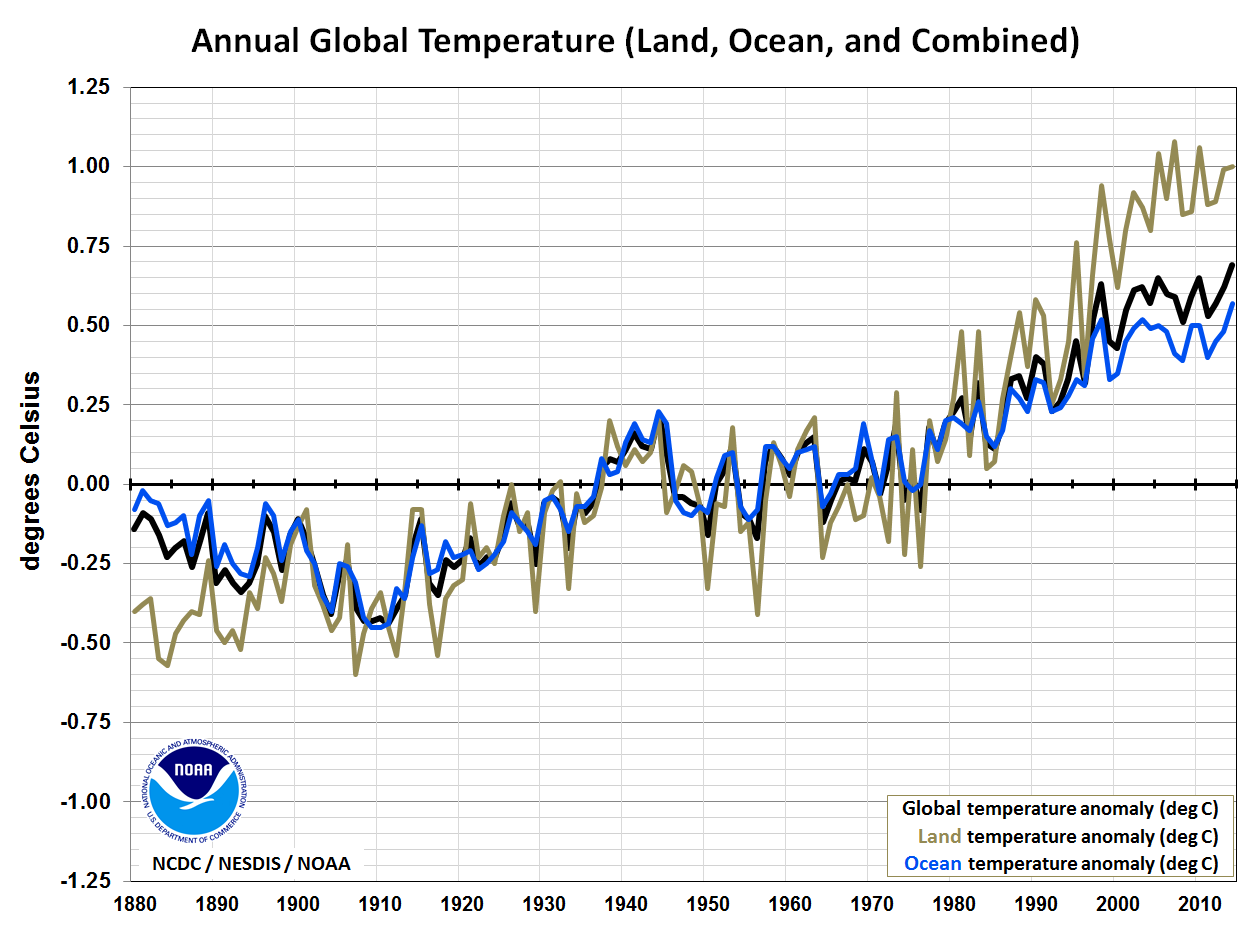
Global temperature increase (Figure 2) is expected to influence the frequency, severity, and seasonal patterns of precipitation and monsoon events, resulting in regional changes in flood and drought hazard. The intensity and frequency of the most extreme tropical cyclones have increased in the North Atlantic since 1980 3, and spatial shifts in cyclone tracks have resulted in increased landfall intensity of cyclones in East Asia. 4 There has been no clear upward trend in extratropical cyclone activity in the North Atlantic basin, 5 but there have been increases in such activity in the South Atlantic–Indian Ocean basin and decreases in the South Pacific. 6 In future, the tracks of Southern Hemisphere and North Pacific extratropical cyclones are expected to shift toward the poles, 7, 8 and there is likely to be an increase in associated precipitation. 9
Climate influences on flooding
Sea-level rise is associated with ice sheet melt, thermal expansion of ocean waters, and change in liquid water storage on land. Between 1901 and 2010, the global average mean sea level rose by an estimated 0.19 m, 8 and it is likely to rise by 0.26–0.55 m by 2100 relative to the period 1986–2005—even if climate policies are effective in reducing greenhouse gas emissions from 2020 onward. 8
Very few coastlines around the world will avoid the effects of sea-level rise, which will result in more frequent and severe coastal flooding, including storm surge associated with cyclones, and increased disaster losses. Where land is sinking due to subsidence and shorelines are retreating due to coastal erosion, coastal flood hazard is increasing dramatically. Given the global increase in hazard and the location of significant populations and assets along coasts, it is crucial that DRM and climate adaptation strategies address the factors driving evolution of the coastal flood hazard.
Flooding causes severe disruption—not only to the urban environment but also to agriculture and rural livelihoods (Figure 3). Intensification of and seasonal shifts in rainfall, snow melt, and deglaciation of mountain ranges 11 alter the timing, severity, and geographical distribution of extreme river flood events in all regions of the world. There is no clear signal of climate change in the increasing losses observed over the past several decades; 12, 13 these are primarily driven by exposure change. Future changes in flood hazard—specifically flood frequency and intensity—are expected, however. 2 Another important consideration in this context is the interannual climatic variability associated with El Niño and La Niña, which influence flooding in river basins covering almost half of the earth’s surface. 14
Human influences on flooding
Flooding is significantly affected by human activity: deforestation and expansion of urban drainage systems and impermeable surfaces cause an increased amount of surface runoff directly and rapidly into rivers during rainstorms, resulting in more-extreme flood peaks. Subsidence too can increase flood hazard by reducing ground elevation. Subsidence occurs naturally due to earthquakes or the settlement of sediment under its own weight, but is often the result of human actions, primarily extraction of groundwater from underground aquifers for irrigation or water supply. Groundwater extraction occurs most intensively in urban areas, and its rate and spatial extent increase as urban populations grow and urban areas expand. In areas with high levels of groundwater extraction, the rate of subsidence can exceed that of sea-level rise, meaning that subsidence is likely to be a greater influence on the increased coastal flood hazard than climate change impacts. 16
“In most of the large delta cities where subsidence is severe (Jakarta, Ho Chi Minh City, Bangkok, Dhaka, Shanghai, and Tokyo), the main cause is extraction of groundwater. Rapidly expanding urban areas require huge amounts of water for domestic and industrial water supply. This need often leads to overexploitation of groundwater resources, especially when surface waters are seriously polluted (Jakarta, Dhaka).” 16
In Manila Bay, Philippines, extraction has contributed to increased flood risk by lowering the land by several centimeters each year—in some years by more than 10 cm. 17 In Jakarta, Indonesia, 2 m of subsidence is estimated to have occurred between 1999 and 2013, with an additional 1.8 m expected between 2013 and 2025. 16 At current rates of subsidence and sea-level rise, and without coastal protection, residential and industrial areas of north Jakarta, major transport links (including the international airport), and ports could be submerged within 100 years. 18
Coastal erosion can cause evolution in coastal flood hazard by reducing the buffer zone that separates coastal populations and assets from coastal hazards (such as flooding, storm surge, and tsunami). Erosion is a global issue, occurring from the coasts of Yorkshire, England, 19 to small island states such as Maldives. 20 Naturally occurring erosion may be exacerbated by sea-level rise or by more frequent storm surge events. Sediment transport deficit can also cause or contribute to erosion; it occurs when the construction of river dams or other coastal works prevents natural sediment refill. The development of a coastal highway in Alexandria, Egypt, for example, has reduced the amount of sediment reaching coastal areas, contributing to “chronic long-term coastal erosion” of c. 20 cm per year. 21
Changing landslide hazard
Heavy rainfall and flooding contribute to slope instability by increasing soil water pressure and undercutting slopes or cliffs. Intensification of and seasonal shifts in rainfall thus lead to evolution in landslide hazard. According to an analysis of fatal landslides in Southeast Asia, the upward global trend in the number of reported landslide fatalities is strongly attributed to increased population on landslide-prone land, destabilization of slopes, and deforestation. 22 Landslides are sensitive to high-intensity precipitation events related to high temperatures, 23 and the number of fatal landslides is influenced by monsoon intensity and the number of tropical cyclones making landfall. 22 Climate change–driven changes in heavy precipitation are expected to increase slope instability and mass movement. 2 Because landslides are often triggered by earthquakes, reduction in slope stability increases the risk of earthquake fatalities and loss.
Uncertain changes in drought hazard
There are distinct regional variations in the projected direction of change in drought, and in the magnitude of factors contributing to drought (i.e., precipitation, runoff, soil moisture, and evapotranspiration). Whereas some studies have found signals of increases in drought occurrence under climate change, 24, 25 such trends are not considered significant on a global scale. 26
Drought Classification
- Meteorological drought (i.e., a relative deficit of precipitation)
- Agricultural or soil moisture drought (i.e., a relative deficit of soil moisture in the root zone)
- Hydrological drought (i.e., a relative deficit of groundwater, streamflow, or lake levels) 2
- Water scarcity or socioeconomic drought (i.e., a deficit in water availability relative to the water consumption by households, agriculture and industry) 25
On a global scale, the estimated share of the world population facing water scarcity, or socioeconomic drought (that is, drought partially driven by human activities such as intensive agriculture or groundwater extraction), increased from 20 percent in 1960 to 50 percent in 2000. 27 In the short term (6 to 10 years), hydroclimatic variability is responsible for almost 80 percent of the yearly change in water scarcity, whereas socioeconomic development is the driving force behind long-term changes. Projected warming by several degrees is likely to reduce precipitation in the Mediterranean, southwest United States, and southern Africa, and to decrease runoff and soil moisture in southern Europe and the Middle East. In these already water-scarce regions, 8 warming is likely to exacerbate water scarcity. The IPCC has high confidence that heat and drought stress will reduce crop productivity, increase pest and disease damage, and lead to flood impacts on food system infrastructure, which will in turn harm livelihoods and food security.
Extreme heat and wildfire
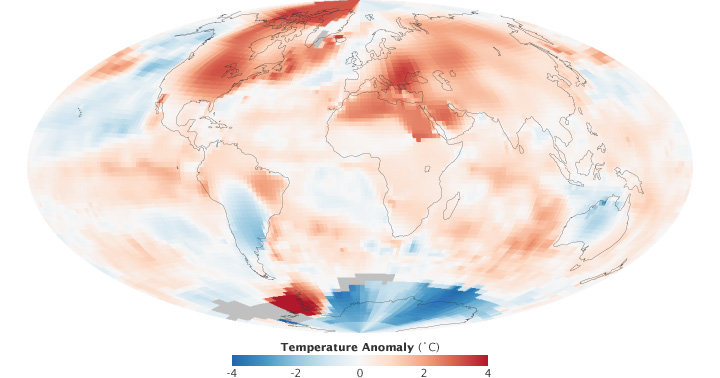
Rising temperatures are expected to result in greater severity, frequency, and extent of extreme heat events—both “highly unusual” events (such as those in Russia and Central Asia in 2010 and the United States in 2012) and “unprecedented” events (which have not occurred under present-day climate conditions). 28 Such heat events are a primary driver of climate-related human migration 29 and are a cause of human health problems. Figure 4 indicates the regional scale of high temperatures through a snapshot of one month—July 2012—in which temperatures were higher than the long-term average. These July temperatures contributed to an historically severe drought in 2012: in that year, severe-to-extreme drought affected 39 percent of the United States—the largest extent since the 1950s. 30
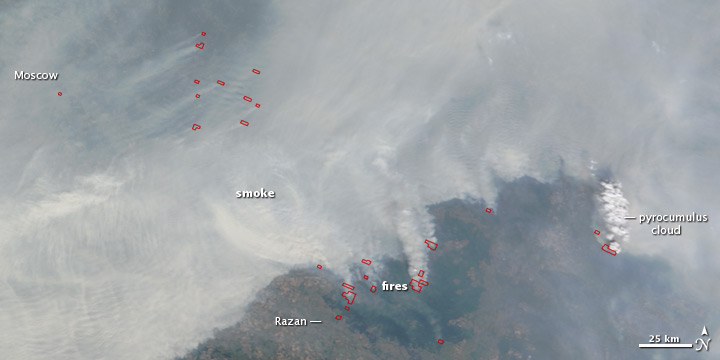
Large wildfires’ frequency and severity (in terms of area burned) are expected to increase in a warmer climate, 32 in which hotter and drier conditions, an increase in fuel, and more frequent lightning will lead to longer fire seasons. Climate change is expected to have a minor impact on wildfire risk in North America and South America, but a major impact in southern Europe and East Africa. 33 The impacts of escalating wildfires are substantial in many regions of the world, and include lives and homes lost, substantial costs of suppression, and large damages to ecosystem services. There have been several high-profile wildfires in the last several years, 34 including 500 wildfires around Moscow, Russia, during the hottest summer for 400 years (Figure 5), resulting in a 25 percent crop failure, 55,000 deaths, and economic losses of US$15 billion (2010).
Drivers of Evolving Disaster Risk: Exposure
The rise in disaster losses over the past decades can be attributed mainly to changes in socioeconomic factors—population and asset values of structures and infrastructure. The effect of exposure on increasing disaster losses is strong, and has been established with much more confidence than the effect of hazard and vulnerability. 12
“Increasing exposure of people and economic assets has been the major cause of long-term increases in economic losses from weather- and climate-related disasters (high confidence)” (9). 2
Increases in global exposure to natural hazards have largely been driven by population growth and rising urbanization rates. The global population exposed to river and coastal flooding, for example, doubled between 1970 and 2010, increasing from around 520 million to almost 1 billion. 36 In the same period, the total urban surface area exposed to flooding increased by a greater proportion, from 18,000 to 44,000 km². Both population and urbanization are expected to continue their growth trend into the future.
Regional contributions to growth and rates of urbanization are variable (figure 6). Probabilistic analyses of United Nations population data show that the population of Asia is expected to peak at over 5 billion people in 2050 and then decline until 2100. The populations of Europe, North America, and Latin America and the Caribbean are expected to remain around their current size, and the population of Africa shows the largest expected increase, from 1.1 billion today to 2.5 billion in 2050 and over 4 billion in 2100. 37
Urbanization — the increase in proportion of the world population living in cities compared to rural areas — is a particularly important factor in evolving exposure. Cities are dense, highly concentrated locations of exposure, so when they are affected by a disaster, losses can be disproportionately large.
Rapid and unplanned expansion of urban populations increases exposure either through increased density, as cities build upward, or by outward expansion, as the population increases, spreads over a wider area, and causes changes in land use – visible in satellite night time light data (Figure 7). In many urban areas that have expanded rapidly in the past decades, the absence of urban planning has led to uncontrolled developments in hazardous areas, such as landslide-prone hillside favelas in Rio de Janeiro and settlements in areas of high flood hazard in Jakarta, Manila, and Bangkok.
Increased exposure in coastal cities is an important driver of risk; these cities are already among the most populous in the world 37 and have a huge amount of infrastructure exposed to coastal flooding and storm surge. These cities are also among the most rapidly growing. Coupled with the effects of evolving coastal hazards, this swift increase in exposure makes these cities among the key areas in which to address evolving disaster risk. Studies forecast an increase in global exposure to river flood hazard in the future, based on models describing spatial changes in socioeconomic development 36, 39 or a combination of climate change and socioeconomic development. 40, 41
Drivers of Evolving Disaster Risk: Vulnerability
Vulnerability refers to the susceptibility of exposed people, assets, and livelihoods to the harmful effects of natural hazards. Physical, or structural, vulnerability refers to the damage associated with buildings and infrastructure, which determines asset losses. These losses are typically the concern of the (re)insurance and engineering industries, which focus on estimating loss to insured assets and mitigating structural damage, respectively. Socioeconomic or social vulnerability refers to people’s ability to cope with the impacts of asset losses on their livelihood and security. These impacts, along with losses to public assets, are a focus for governments.
Socioeconomic vulnerability
Socioeconomic vulnerability may evolve over time positively or negatively depending on a large number of influencing factors, such as education, age, wealth, and access to resources and political power. 43 Depending on their level of vulnerability, different groups and communities are more or less able to respond during a disaster, cope in its aftermath, and subsequently recover. As hazard distributions change, some vulnerabilities in a given area may decline and others become more important. For example, elderly populations in Europe are likely to become more vulnerable in future as extreme heat events become more frequent. Vulnerability is higher in low-income countries than high-income countries, and global vulnerability is gradually declining. 15, 44 On the other hand, gradual environmental degradation or sudden shocks that impact livelihoods or people in a region or community increase vulnerability and can lead to higher vulnerability for a long period of time. Vulnerability can remain high if reconstruction or adaptation is not undertaken, or if maladaptation occurs during unplanned or poorly planned development. 45 Social vulnerability varies substantially between countries, within the same country, and even on a subcity level; decisions on the implementation of disaster risk management strategies need to take this variability into account.
Structural vulnerability
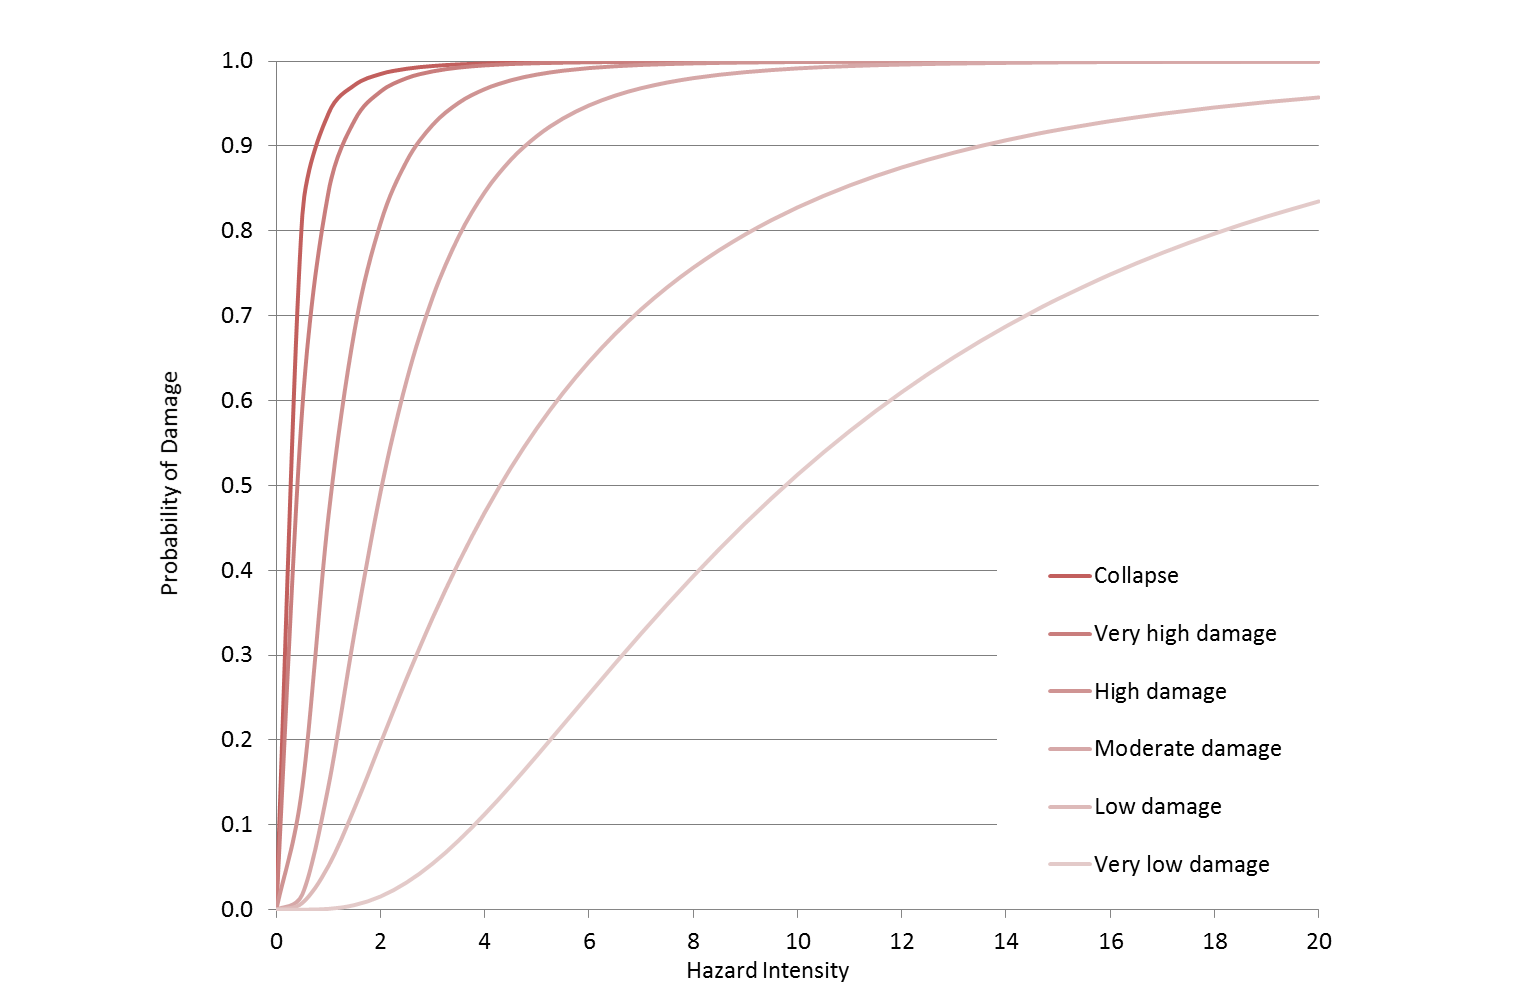
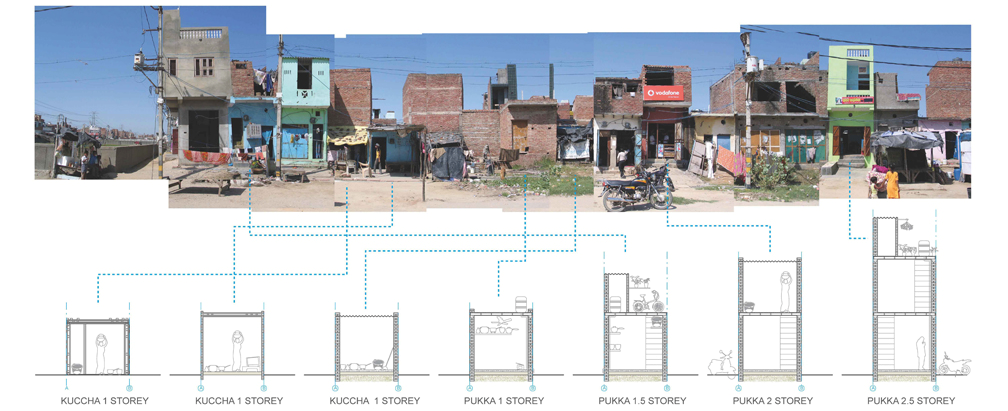
The physical vulnerability of a structure or piece of infrastructure determines the level of damage the asset sustains in response to a given level of hazard intensity. Physical vulnerability is usually presented in the form of a vulnerability curve (or fragility curve; see Figure 8), which shows the probability of a damage state being exceeded for a given hazard intensity. The primary factors determining a structure’s vulnerability to damage are construction type (e.g., timber, unreinforced masonry, reinforced concrete, or steel), number of stories, and (for wind hazards) roof construction. Physical vulnerability can increase over time if a structure or infrastructure is not maintained. Vulnerability also evolves as a result of modifications made to structures. Informal construction is common in many parts of the world, given inadequate building standards and informal planning and construction practices in many rapidly developing urban areas. 46 Where individuals undertake expansion of their own buildings without planning restrictions or engineering guidance—and when these buildings were likely nonengineered to begin with—the construction of additional stories and changes to buildings’ configuration can increase vulnerability (Figure 9).
As an urban population grows, the infrastructure that serves that population must be developed to keep pace with demand; otherwise, system capacity will be exceeded and infrastructure will become more vulnerable to shocks. Critical systems must maintain some redundancy so that they are able to cope in the case of disasters. Likewise, disaster response capacities must keep pace with the increase in potential demand.
Quantifying the Evolution of Disaster Risk
Most disaster risk assessment tools developed to date focus on the static assessment of current risk, without accounting for the evolving nature of the underlying drivers. Thus most risk assessments do not accurately reflect longer-term dynamics, and decisions based upon these assessments may not be optimal. Over time, disaster risk assessment has improved and grown more sophisticated 48, but due to the large uncertainties in projecting risk, and a focus on near-term time horizons for managing risk (particularly in the financial sector), efforts to model the evolution of risk have only recently been undertaken. A recent review of open source and open access risk assessment tools 49 showed that of 80 risk tools reviewed, none included explicit modeling of future risk. However, risk models can be augmented with data representing future conditions (e.g., higher sea level or increased population density). As more input data become available, and as hazard and exposure projection data are developed, assessments are better able to consider evolving risk. Although an increasing number of analyses are using these projection data sets, the current state-of-the-art in modeling of evolving disaster risk still has various limitations.
Most disaster risk assessment today is static, focusing only on understanding current risks. A paradigm shift is needed toward dynamic risk assessments, which reveal the drivers of risk and the effectiveness of policies focused on reducing risk.
Simple or complex approach
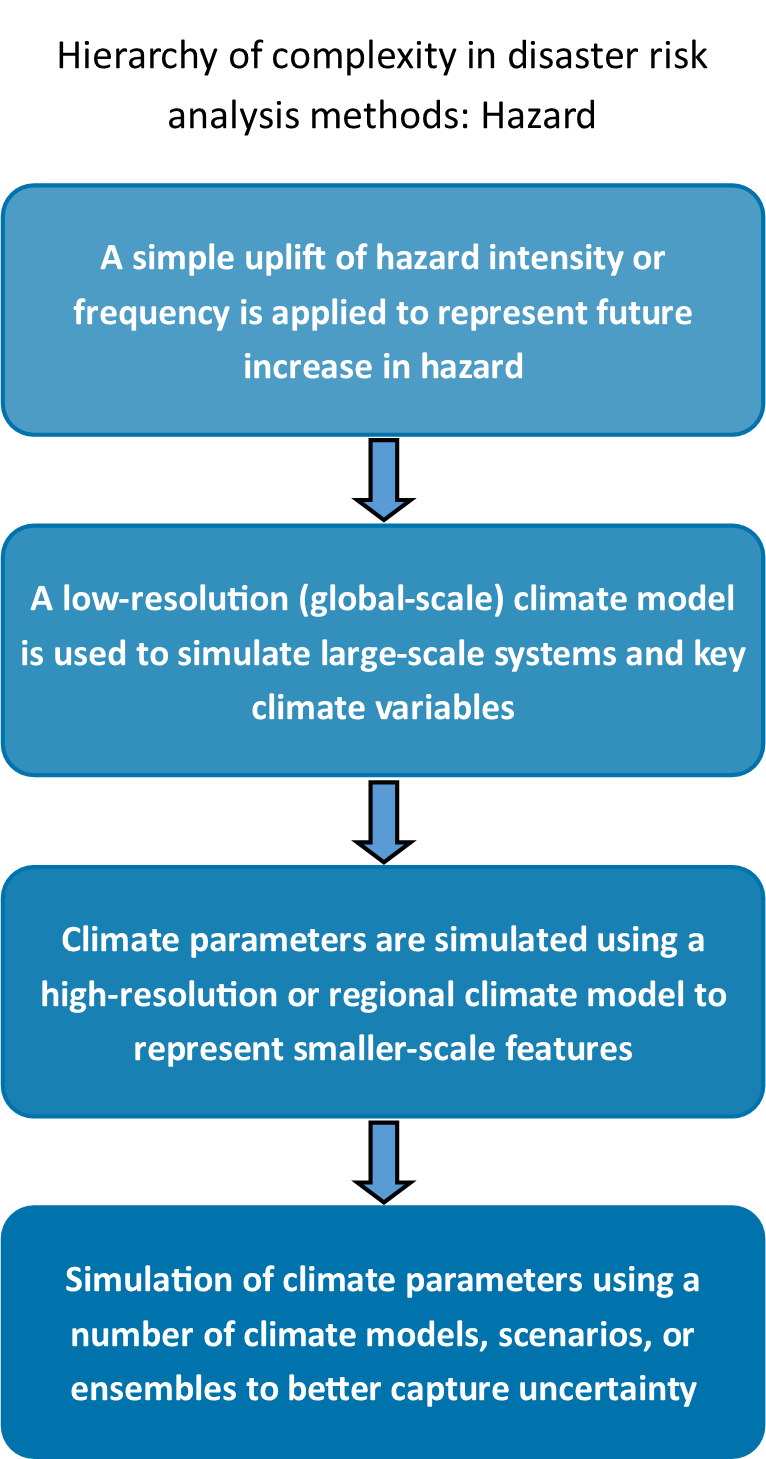
Disaster risk assessments vary greatly in complexity depending on data available and requirements of the assessment (Figure 10). They can use a single scenario or thousands of years of simulated events, with statistical distributions to represent probability of hazard intensity and damage as well as uncertainty. Evolving hazard has been quantified in a number of studies investigating the effect of climate change on flood, cyclone, drought, wildfire, and extreme temperatures. The benefit of simple approaches is their relatively low computational cost, which makes them replicable across large areas or for numerous case studies. More complex modelling is used to capture important details required for planning and implementing risk reduction strategies.
Modeling interrelated and evolving hazards
Risk assessments generally deal with a single hazard, although a few consider multiple factors that influence the hazard, for example coastal flood assessments that include rising sea levels, changing storm intensity, and subsidence. Too few assessments include interrelated (cascading and coincident) hazards. Thus they omit compounded risks under present conditions, which become increasingly important when investigating future risk. To understand the importance of some factors, consider that a study of future flood hazard in Jakarta found subsidence contributed an increase in damage of 173 percent by 2030. This represents a significant proportion of total increase of 263 percent caused by all factors, including precipitation and sea-level rise as well as subsidence. 51 Failing to combine all relevant factors can lead to underestimation of risk and hence to inadequate DRM actions.
Uncertainty in risk assessment
There is uncertainty in all risk assessments, whether they are assessing present risk or projecting future risk. These are due to natural variability in earth’s systems, data availability, and limitations in modeling methods.
A short instrumental record or sparse observations of hazard phenomena introduces uncertainty in characterizing hazards with long-term recurrence of events and cycles of natural variability. Paleoseismic and paleoclimate studies help to reduce uncertainty by extending our record of events further back in time, but in many cases there remains uncertainty in the accuracy of dating and interpretation of data. Technological capabilities also limit our knowledge of certain physical processes: for example, if the resolution at which we can monitor and investigate small-scale atmospheric phenomena, such as cloud formation, is low, a degree of uncertainty is introduced into results that rely on that process. As a result, there is significant uncertainty around regional and local climate change impacts, particularly around changes in frequency and intensity of precipitation and cyclone winds.
Use of climate projections in disaster risk assessment
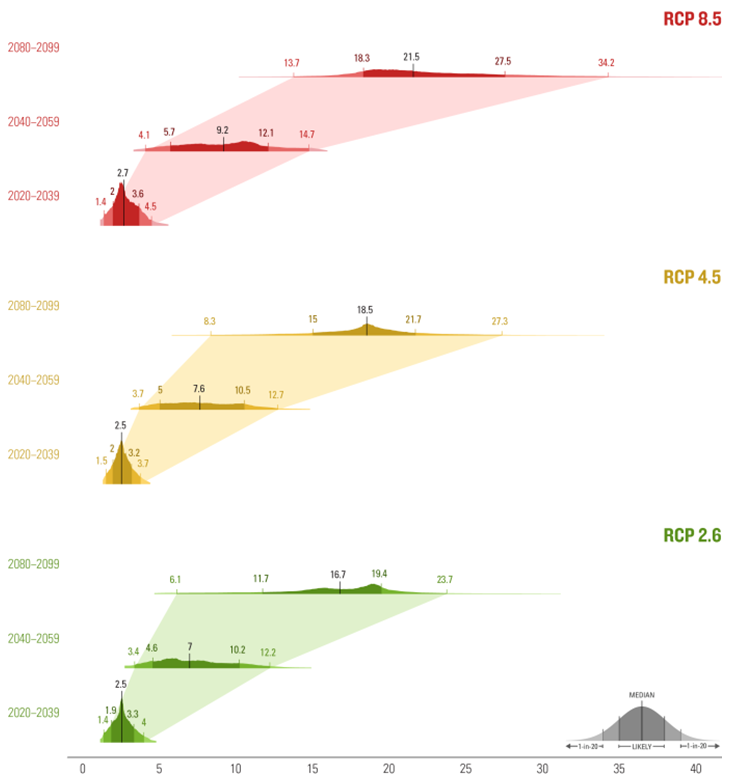
The use of multiple climate models in analyses is designed to demonstrate a range of views on how the climate system operates. Exercises that compare the results of multiple models, such as the Coupled Model Intercomparison Project (CMIP5), demonstrate the ability of climate models to reproduce current climate and historical climate trends, provide spatial patterns of atmospheric circulation, and consistently predict a warming climate. Using these models, projections are made for precipitation, temperature, sea level rise etc. (Figure 11), under future climate conditions, which are usually based on the Representative Concentration Pathways (RCPs).
The Representative Concentration Pathways
The RCPs are four climate-outcome scenarios based on combinations of economic, technological, demographic, policy, and institutional futures. They are presented in terms of total radiative forcing (cumulative measure of human emissions of greenhouse gases [GHGs] from all sources). The higher the radiative forcing, the greater the climate warming; the warming occurs because there is more incoming solar energy and absorption of energy by GHGs than outgoing reflected energy. These pathways are applied as anthropogenic forcing conditions in global climate models to model future scenarios of climate. The Intergovernmental Panel on Climate Change Fifth Assessment Report is based upon these RCPs:
Source: IPCC Data Distribution Centre 52
Uncertainty in exposure data and projections
There is significant uncertainty in estimates of current exposure (i.e., people, infrastructure and assets located in hazard-prone areas), especially in data-scarce areas in low-income countries. This is because exposure estimates are often based on data that may be incomplete and several years old. These data are projected to the current year and future years using growth projections from national data and economic models based on relationships that may not account for all factors in population growth or movement. For example, the majority of current global disaster risk projections have so far relied on the extrapolation of current spatial population density based on national-level population and/or GDP growth figures. 36, 53, 54 Such studies therefore assume that the distribution of people and cities will remain stable going forward, an assumption that has a strong effect on the outcomes of any projection, and any risk assessment that incorporates that projection.
To simulate future hazard, it is possible to include projections of precipitation, temperature, humidity, etc., under future climate conditions. These parameters are generated by regional and global climate simulations that are based on the Representative Concentration Pathways (RCPs). Such methods have been used to investigate the potential impacts of changes in precipitation, 49 drought, 50 and sea-level rise 51 (see Figure 8). More commonly, scenario-based adjustments are made to current patterns of frequency and intensity of hazards in order to reflect future changes. For example, a simple uplift in potential hurricane intensity was used by Hallegatte 52 to assess future losses.
Complexities in modeling evolving exposure
As an important driver of disaster losses, changing exposure must be accounted for in the quantification of future risk. Constantly evolving exposure can have particularly important impacts in areas of rapidly expanding population and urban development, or in areas that are particularly susceptible to changes in hazard, for example low-lying coastal areas or Small Island Developing States, which are highly susceptible to rising sea levels. Many risk assessments use a snapshot of exposure data, taken from the present or from some time in the past; an example is the use of census data to establish the population at risk. But this approach offers only a static view of past exposure. Evolving exposure can be incorporated into existing model frameworks by projecting spatial trends in land use (indicating urbanization), population growth, and economic assets.
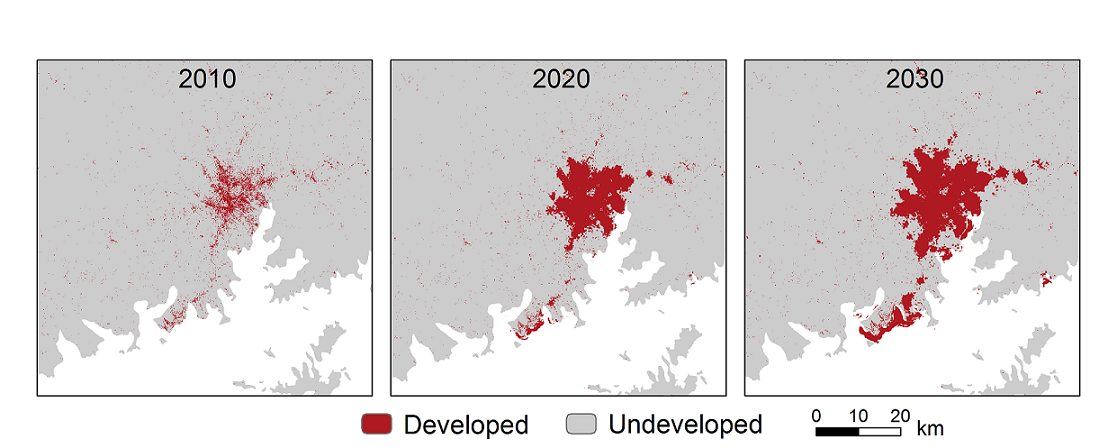
Mapping past urban extent (Figure 12) can make it possible to visualize spatial patterns of expansion and can help validate projections of expansion (e.g., Figure 13). When future projections of population, demographics, and population distribution are considered alongside projections of socioeconomic conditions in the Shared Socioeconomic Pathway (SSP) scenarios, they can be developed and incorporated into disaster risk assessment.
The Shared Socioeconomic Pathways
The SSPs are five “reference pathways describing plausible alternative trends in the evolution of society and ecosystems over a century timescale, in the absence of climate change or climate policies.” 58 Each SSP consists of a narrative storyline, which provides a starting point for the quantification of factors that influence population and economic growth. SSPs are incorporated into the Integrated Assessment Model (IAM) draft scenarios that provide population, urbanization, and gross domestic product projections for every decade until 2100. 60
SSPs are generally described as follows:
- SSP 1: Low challenges for mitigation and adaptation—reasonably high pace of sustainable development, technological change, and environmentally friendly processes
- SSP 2: Moderate—an intermediate case between SSP 1 and SSP 3
- SSP 3: High mitigation and adaptation challenges—low adaptive capacity in many regions, moderate economic growth, and unmitigated emissions
- SSP 4: Low mitigation challenges, high adaptation challenges—regionally divided technological development, with some regions able to mitigate emissions, but others left with low adaptive capacity
- SSP 5: High mitigation challenges, low adaptation challenges—absence of climate policies and low investment in alternative energy technology; rapid economic development leads to equitable distribution of resources and globally high adaptive capacity
Evolving vulnerability: An ongoing challenge
Compared to hazard and exposure, vulnerability has, to date, been quantified to a very limited extent in the context of evolving risk. Studies commonly assume future vulnerability to be the same as present-day vulnerability. Global changes in vulnerability and their effects on disaster risk therefore remain highly uncertain. Some methodologies have been developed that project social vulnerability in terms of socioeconomic conditions and structural vulnerability based on development of the building stock, but these approaches have been implemented in a few cases only. Since social vulnerability is influenced by a wide range of factors, it is a complex task to estimate how vulnerability might evolve over time and to incorporate changing vulnerability into disaster risk assessments. Incremental building construction is an important driver of changing structural vulnerability, influenced by socioeconomic changes. When buildings are expanded outward and upward, their vulnerability to earthquakes changes. Building expansion models can be used to simulate changes in building stock over future decades due to informal construction or adherence to building codes, and have shown that informal building expansion increases risk through time. 59
Identifying Effective Policies for a Resilient Future
Decision makers have the opportunity now to positively influence the future evolution of disaster risk: decisions made and actions taken in the present or near future can arrest increases in future disaster risk. To inform development decisions, policies should take into account scientific findings on future climate conditions and the results of quantified disaster risk projections.
Disaster risk evolves—and losses increase—when planning fails to take into account the existence of hazards and the impact of socioeconomic development on exposure and vulnerability. Moreover, some policies can inadvertently increase disaster risk by increasing exposure in hazardous areas or allowing practices that increase vulnerability.
There are multiple DRM policy tools and strategies available. Combining a variety of policies is the best way to mitigate risk and provide adaptive capacity at different spatial and temporal scales and correlations 60, and in different sectors of the economy and population. For example: physical defenses provide protection from small, frequent events at the local scale; land-use planning can reduce exposure (in balance with the need to exploit valuable land that may be hazardous, e.g., coastlines); and insurance mechanisms can target high-loss events that occur less frequently, such as those with return periods of hundreds of years.
This section highlights a number of policies that can have a positive impact on the evolution of disaster risk.
Mitigate climate change
Mitigating emissions to limit the continued increase in global temperatures that is expected in the next decades is key to mitigating disaster risk (manifested as changes in the rate of sea-level rise (Figure 14) and intensity, frequency, and spatial distribution of cyclone, flooding, and drought). There is a wide body of literature on the mitigation of climate change and available strategies that decision makers can use to reduce emissions, such as implementing new technologies and changing consumption behaviors through taxation and regulation. Mitigation policies can operate at the national economy level and within specific sectors. 61, 62 For example, the energy sector could move from investment in extraction of fossil fuels to investment in renewables, nuclear, and carbon capture and storage (CCS) technologies. In agriculture and forestry, conservation and management of land and food resources could decrease deforestation and maximize supply from agricultural land while reducing emissions. 63
Avoid and mitigate the effects of harmful land-use change
Land-use change that occurs with urban development or deforestation of land for agricultural use can increase flood risk by increasing peak river flow volumes and the speed of runoff over land. A major influence on this change in flow regime is the replacement of natural surfaces with impermeable surfaces.
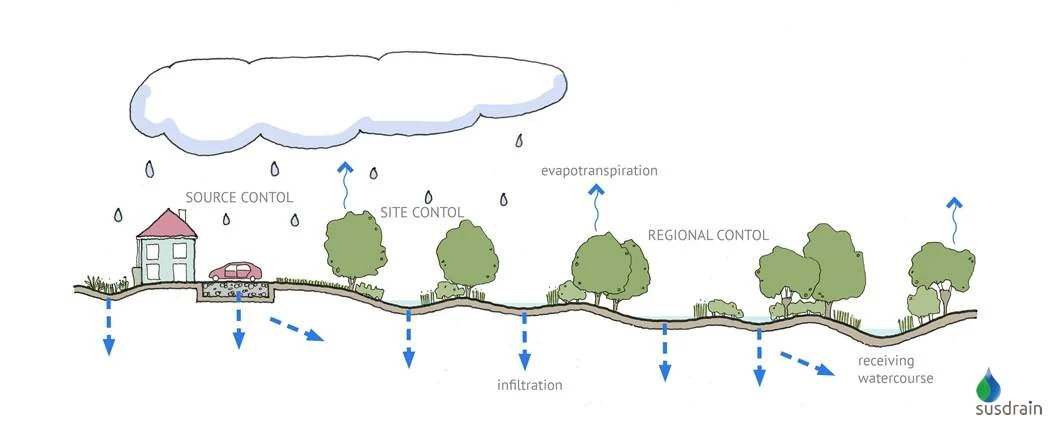
Retention of natural land surfaces and use of sustainable urban drainage systems (Figure 15) can mitigate the negative effects of land surface change on flooding. In some areas of unplanned development, drainage systems are inadequate to carry surface water to rivers or the coast. Installing sustainable drainage systems (those having the capacity to cope with projected rainfall in a future climate) can help to manage urban flood risk. Because changes in the flow regime in upper parts of river catchments can also affect downstream reaches and communities, catchment-level analyses are required to assess the impact of land-use change on flood risk for the whole catchment.
Decelerate rates of coastal subsidence
The implications of urban expansion must be accounted for in effective urban planning and resource management. Subsidence due to groundwater extraction is a very important factor in increasing coastal flood risk; indeed, subsidence often contributes more to relative sea-level change than sea-level rise.
Using alternative sources of water, such as piped supply from surface reservoirs, can reduce the proportion of urban supply that is sourced from aquifers beneath major cities. Increasing the market price for groundwater pumping versus piped supply can also help to reduce groundwater extraction 66; in Jakarta, for example, groundwater supply is taxed. Subsidence can be reduced and halted by reducing groundwater extraction, although it can take years for the groundwater level to rise sufficiently for subsidence to stop altogether, as the experience of Tokyo shows. 16.
Carry out urban expansion with risk-conscious planning
Change in exposure is responsible for the majority of increase in disaster risk. Population growth and urban expansion in hazard-prone regions rapidly increase disaster risk, especially in low-income countries. Community and urban development plans should include land-use planning policies to prevent new development on (or change in use of) hazard-prone land and to reduce exposure to hazards where possible.
Land-use planning legislation can be part of the effort to prevent new development in hazardous areas, to relocate assets to less hazardous locations (“managed retreat”), or to restrict the types of land use permitted in hazard zones—that is, to allow nonintensive uses, such as open community spaces, and prohibit residential use.
When land-use planning decisions relate to hazards that can evolve in future climates, they must take those future conditions into consideration. (Such decisions are exemplified by land-use restrictions within riverine or coastal flood hazard zones.) It is also important to ensure that structures and communities established in areas considered nonhazardous today are not found to be at risk in several decades. Thus development currently being planned or approved must account for the potential for more frequent and extensive inundation from rising sea levels or more extreme precipitation in the future.
Carry out resilient post-event reconstruction
There is often a post-disaster window of opportunity during which decision makers can increase resilience to future events through land-use planning or resilient reconstruction. By relocating assets or critical infrastructure out of hazard zones, a reconstructed community may reduce its exposure to future hazards. In the reconstruction plans for Tohoku, Japan, following the 2011 earthquake and tsunami, residential buildings, schools, and hospitals were relocated out of the tsunami hazard zone. The plan reserved the highest-hazard areas for low-density activities (such as light industry), activities that needed to be located on a coast, or activities requiring open space; this approach sought to minimize economic loss and loss of life in future events. Similarly, reconstruction in Christchurch, New Zealand, following the 2011 earthquake has reserved large areas of the city for use as green space due to the high liquefaction hazard. As a rule, post-disaster reconstruction should take into account technical, economic, sociocultural, and regulatory aspects of planning and building design to reduce future risk, and should also consider sustainable design and construction of water, sanitation, and transport infrastructure. 67
Ensure sustainable and safe habitation
New construction and urban development should be designed to be sustainable and to ensure safe habitation in projected climate conditions of increased heat extremes and changing patterns of intense precipitation. Relevant policy should take into account the fact that building construction and use contribute to climate change through CO² emissions in construction and energy use over the building’s lifetime.
There are significant lock-in risks associated with the long lifespans of buildings and related infrastructure 68
The habitability of structures is an important issue both in regions facing high temperatures under the current climate and in regions expected to experience increased temperatures over the coming decades. Heat stress can be mitigated by climate-aware urban planning (which comprises strategically placed “green” and “blue” spaces), and—once a heat wave hits—it can be responded to by providing affected populations with information and cooling facilities. Individual buildings can be made safer for inhabitants during heat waves through sustainable temperature control, which relies not on air conditioning but on natural cooling and ventilation systems and shading (for example, by fitting shutters).
Implement and adhere to building codes
Implementing mandatory building codes and affiliated construction standards is an important step in increasing disaster preparedness. Building codes have been implemented for floods, hurricanes, and earthquakes in a number of countries, and have been shown to successfully reduce disaster losses. 69 It is crucial, however, that building restrictions continue to be adapted to increasing flood hazard under climate change and human activities in the floodplain. 70
Controlling building practices through legislation or nonstatutory means can determine the evolution of vulnerability into the future. For example, the introduction of building legislation following an earthquake in New Zealand in 1931 likely meant that there were far fewer vulnerable unreinforced masonry homes in Christchurch, New Zealand, in 2010–2011, when the city was affected by a series of damaging earthquakes. The number of lives saved in just one event because of legislation decades earlier may be difficult to quantify, but this case clearly suggests the long-term benefits of building codes.
Strengthen inclusive community resilience
Community resilience determines the degree to which affected groups of people are able to bounce back—or, preferably, bounce forward—after a disaster hits. 71 Strengthening resilience is therefore crucial for ensuring that recovery from disasters takes place quickly, incorporates effective adaptation, and reduces vulnerability to ongoing hazards and the next disaster. But a community’s resilience cannot be strengthened unless it is understood. Resilience is a product of a range of factors, including social, infrastructural, community capital, economic, institutional, and environmental dimensions. 72 Measures targeted at increasing community resilience therefore need to address one or several of these dimensions. For example: insurance programs and social safety nets can be effective in reducing the financial capacities of affected communities directly after the shock; strong institutions and low inequality can enable effective collaborative reconstruction; strong medical facilities may reduce the spread of water-borne diseases after a flood; and sturdier housing types may reduce the required rebuilding efforts after an earthquake.
Use ecosystem-based solutions
Ecosystem-based solutions can be used on the regional scale to mitigate climate changes (e.g., maintenance of forested land); on the local scale they can address a variety of hazards. Commonly, engineered flood protection structures such as levees, dams, and flood detention areas are installed along rivers and coastlines to provide defense against flooding. Such engineered solutions are also an option for tackling drought (e.g., irrigation, wells, drought-resilient crops) and heat waves (e.g., air conditioning, urban planning). Although these engineered solutions can provide a high level of protection, their negative impact on natural processes is large and often leads to a disturbance of ecosystem functioning, which in turn reduces the well-being of local communities. 73 Alternatives to engineered approaches include nature-based approaches or hybrid approaches that combine engineered and nature-based solutions.
“Ecosystem-based options are the most affordable and have positive additional consequences, but are often not as effective as other options at reducing the impact of the hazard. The evidence-base to support these options tends to be weaker so there is uncertainty regarding their effectiveness (62).” 74
Nature-based approaches to managing the risk of urban, riverine, and coastal flooding include maintenance of floodplains and increase in vegetation. Sustainable urban drainage systems (SuDS) represent a hybrid approach. The recent emphasis on nature-based flood protection is especially relevant in a world where the flood hazard is increasing as a result of rising sea levels and higher peak river discharges. Natural shorelines evolve in response to such changing conditions and require less maintenance than traditional protection structures. 75
Promote sustainable investment
Sustainable investment can be encouraged by considering future risk in rollout of risk reduction programs. Policy instruments exist for influencing the evolution of disaster risk, but they must be enacted in development and risk management programs being implemented now. These programs have long lives, and if they are not tailored to future climates, they will not be sustainable. The development sector and the disaster risk assessment community must collaborate both to ensure that programs consider the impacts of exposure and vulnerability (rather than the impacts of climate change alone) on evolving risk, and to prevent the maladaptation that arises when development and reconstruction programs construct facilities in areas of high hazard. This collaboration must overcome institutional, practical, and perceived barriers. 76
In planning any DRM strategy, consideration of future disaster risk is vital for ensuring that the investment is viable into the future, and that the development is sustainable and does not exacerbate disaster risk. Disaster risk assessments and DRM strategies should also account for the interrelation of hazards so that the effort to mitigate one hazard does not inadvertently exacerbate others. 76
Further information
For further information on available methods of incorporating evolving disaster risk into risk assessments, including a variety of case studies, please see the full PDF report.
References
[1] Global Facility for Disaster Reduction and Recovery, Understanding Risk in an Evolving World — Emerging Best Practices in Natural Disaster Risk Assessment (Washington, DC: World Bank, 2014), http://www.worldbank.org/content/dam/Worldbank/Feature%20Story/japan/pdf/101414_event/Understanding_Risk-Web_Version-rev_1.8.0.pdf.
[2] Intergovernmental Panel on Climate Change, Managing the Risks of Extreme Events and Disasters to Advance Climate Change Adaptation (Cambridge: Cambridge University Press, 2012), https://www.ipcc.ch/pdf/special-reports/srex/SREX_Full_Report.pdf.
[3] J. P. Kossin, K. R. Knapp, D. J. Vimont, R. J. Murnane, and B. A. Harper, “A Globally Consistent Reanalysis of Hurricane Variability and Trends,” Geophysical Research Letters 34 (2007), DOI:10.1029/2006GL028836, http://www.ssec.wisc.edu/~kossin/articles/Kossin_2006GL028836.pdf.
[4] D.-S. R. Park, C.-H. Ho, and J.-H. Kim, “Growing Threat of Intense Tropical Cyclones to East Asia over the Period 1977–2010,” Environmental Research Letters 9 (2014): 014008, http://iopscience.iop.org/1748-9326/9/1/014008.
[5] G. C. Leckebusch, U. Ulbrich, L. Fröhlich, and J. G. Pinto, “Property Loss Potentials for European Midlatitude Storms in a Changing Climate,” Geophysical Research Letters 34, no. 5 (March 2007): L05703, http://onlinelibrary.wiley.com/doi/10.1029/2006GL027663/abstract.
[6] X. L. Wang, Y. Feng, G. P. Compo, V. R. Swail, F. W. Zwiers, R. J. Allan, and P. D. Sardeshmukh, “Trends and Low Frequency Variability of Extra-tropical Cyclone Activity in the Ensemble of Twentieth Century Reanalysis,” Climate Dynamics 40 (2013): 2775–2800, http://esrl.noaa.gov/psd/people/gilbert.p.compo/Wangetal2012.pdf.
[7] L. Bengtsson, K. I. Hodges, and E. Roeckner, “Storm Tracks and Climate Change,” Journal of Climate 19 (2006): 3518–43, http://journals.ametsoc.org/doi/full/10.1175/JCLI3815.1.
[8] T. F. Stocker, D. Qin, G.-K. Plattner, L. V. Alexander, S. K. Allen, N. L. Bindoff, F.-M. Bréon, et al., “Technical Summary,” in Climate Change 2013: The Physical Science Basis. Contribution of Working Group I to the Fifth Assessment Report of the Intergovernmental Panel on Climate Change, ed. T. F. Stocker, D. Qin, G.-K. Plattner, M. Tignor, S. K. Allen, J. Boschung, A. Nauels, Y. Xia, V. Bex, and P. M. Midgley (Cambridge and New York: Cambridge University Press, 2013), http://www.ipcc.ch/report/ar5/wg1/.
[9] L. Bengtsson, K. I. Hodges, and N. Keenlyside, “Will Extratropical Storms Intensify in a Warmer Climate?,” Journal of Climate 22 (2009): 2276–2301, http://journals.ametsoc.org/doi/abs/10.1175/2008JCLI2678.1.
[10] NOAA National Climatic Data Center, “NOAA NCDC State of the Climate—Global Analysis Annual 2014,” 2014, https://www.ncdc.noaa.gov/sotc/global/2014/13/supplemental/page-4.
[11] G. Rees and D. Collins, Sagarmatha: Snow and Glacier Aspects of Water Resources Management in the Himalayas. Final Technical Report, vol. 2, An Assessment of the Impacts of Deglaciation on the Water Resources of the Himalaya (Wallingford, Oxfordshire, UK: Centre for Ecology and Hydrology, 2004), http://r4d.dfid.gov.uk/PDF/Outputs/Water/R7980-final-report-volume2.pdf.
[12] H. Visser, A. C. Petersen, and W. Ligtvoet, “On the Relation between Weather-Related Disaster Impacts, Vulnerability and Climate Change,” Climate Change 125, no. 3–4 (July 2014): 461–77, http://link.springer.com/10.1007/s10584-014-1179-z.
[13] Z. W. Kundzewicz, S. Kanae, S. I. Seneviratne, J. Handmer, N. Nicholls, P. Peduzzi, et al., “Flood Risk and Climate Change: Global and Regional Perspectives,” Hydrological Sciences Journal 59, no. 1 (January 2014): 1–28, http://www.tandfonline.com/doi/abs/10.1080/02626667.2013.857411.
[14] P. J. Ward, B. Jongman, J. C. J. H. Aerts, A. Bouwman, R. Van Beek, M. F. P. Bierkens, W. Ligtvoet, and H. C. Winsemius, “Global River Flood Risk Assessments,” in Understanding Risk in an Evolving World—Emerging Best Practices in Natural Disaster Risk Assessment (Washington, DC: World Bank, 2014), 177–84, http://www.worldbank.org/content/dam/Worldbank/Feature Story/japan/pdf/101414_event/Understanding_Risk-Web_Version-rev_1.8.0.pdf.
[15] B. Jongman, H. C. Winsemius, J. C. J. H. Aerts, E. Coughlan de Perez, M. van Aalst, W. Kron, and P. J. Ward, “Declining Vulnerability to River Floods and the Global Benefits of Adaptation,” Proceedings of the National Academy of Sciences of the United States of America 112, no. 18 (2015): E2271–E2280, http://www.pnas.org/content/112/18/E2271.abstract.
[16] Deltares, “Sinking Cities” (Deltares, Delft, 2013) https://www.deltares.nl/app/uploads/2015/01/Subsidence-Sinking-cities_Deltares.pdf.
[17] K. S. Rodolfo and F. P. Siringan, “Global Sea-level Rise Is Recognised, but Flooding from Anthropogenic Land Subsidence Is Ignored around Northern Manila Bay, Philippines,” Disasters 30, no. 1 (March 2006): 118–39, http://onlinelibrary.wiley.com/doi/10.1111/j.1467-9523.2006.00310.x/pdf.
[18] World Bank, “Jakarta Case Study: Overview," in Climate Change, Disaster Risk and the Urban Poor: Cities Building Resilience for a Changing World (Washington, DC: World Bank, 2011), 16, http://elibrary.worldbank.org/doi/pdf/10.1596/978-0-8213-8845-7.
[19] P. Winn, R. Young, and A. Edwards, “Planning for the Rising Tides: The Humber Estuary Shoreline Management Plan,” Science of the Total Environment 314–316 (October 2003): 13–30, http://www.sciencedirect.com/science/article/pii/S0048969703000925.
[20] J. Yan and K. Kishore, “Detailed Island Risk Assessment in Maldives to Inform Disaster Risk Reduction and Climate Change Adaptation,” in Understanding Risk in an Evolving World—Emerging Best Practices in Natural Disaster Risk Assessment (Washington, DC: World Bank, 2014), 132–35, http://www.worldbank.org/content/dam/Worldbank/Feature Story/japan/pdf/101414_event/Understanding_Risk-Web_Version-rev_1.8.0.pdf.
[21] World Bank, “Climate Change Adaptation and Natural Disasters Preparedness in the Coastal Cities of North Africa,” June 4, 2011, http://www.worldbank.org/en/news/feature/2011/06/04/north-african-coastal-cities-address-climate-change-and-natural-disasters.
[22] D. N. Petley, “On the Impact of Climate Change and Population Growth on the Occurrence of Fatal Landslides in South, East and SE Asia,” Quarterly Journal of Engineering Geology & Hydrogeology 43, no. 4 (2010): 487–96, http://qjegh.lyellcollection.org/cgi/doi/10.1144/1470-9236/09-001.
[23] D. N. Petley, S. A. Dunning, and N. J. Rosser, “The Analysis of Global Landslide Risk through the Creation of a Database of Worldwide Landslide Fatalities,” in Landslide Risk Management, ed. O. Hungr, R. Fell, R. Couture, and E. Eberhardt (London: Taylor & Francis, 2005), 367–74, https://www.crcpress.com/product/isbn/9780415380430.
[24] K. R. Briffa, G. van der Schrier, and P. D. Jones, “Wet and Dry Summers in Europe since 1750: Evidence of Increasing Drought,” International Journal of Climatology 29, no. 13 (November 2009): 1894–1905, http://onlinelibrary.wiley.com/doi/10.1002/joc.1836/abstract..
[25] A. Dai, K. E. Trenberth, and T. Qian, “A Global Dataset of Palmer Drought Severity Index for 1870–2002: Relationship with Soil Moisture and Effects of Surface Warming,” Journal of Hydrometeorology 5, no. 6 (December 2004): 1117–30, http://www.cgd.ucar.edu/cas/adai/papers/Dai_pdsi_paper.pdf.
[26] J. Sheffield, E. F. Wood, and M. L. Roderick, “Little Change in Global Drought over the Past 60 Years,” Nature 491, no. 7424 (November 2012): 435–38, http://www.nature.com/nature/journal/v491/n7424/full/nature11575.html.
[27] T. I. E. Veldkamp, Y. Wada, H. de Moel, M. Kummu, S. Eisner, J. C. J. H. Aerts, and P. J. Ward, “Changing Mechanism of Global Water Scarcity Events: Impacts of Socioeconomic Changes and Inter-annual Hydro-climatic Variability,” Global Environmental Change 32 (May 2015): 18–29, http://www.sciencedirect.com/science/article/pii/S0959378015000308.
[28] World Bank, Turn Down the Heat: Confronting the New Climate Normal (Washington, DC: World Bank, 2014), http://documents.worldbank.org/curated/en/2014/11/20404287/turn-down-heat-confronting-new-climate-normal-vol-2-2-main-report.
[29] V. Mueller, C. Gray, and K. Kosec, “Heat Stress Increases Long-term Human Migration in Rural Pakistan,” Nature Climate Change 4, no. 3 (March 2014): 182–85, http://www.nature.com/nclimate/journal/v4/n3/full/nclimate2103.html.
[30] T. R. Karl, B. E. Gleason, M. J. Menne, J. R. McMahon, R. R. Heim, M. J. Brewer, K. E. Kunkel, et al., “U.S. Temperature and Drought: Recent Anomalies and Trends,” Eos Transactions American Geophysical Union 93, no. 47 (2012): 473–74, http://onlinelibrary.wiley.com/doi/10.1029/2012EO470001/pdf.
[31] NASA Earth Observatory, “Mapping the Hot Summer—August 17, 2012,” 2012, http://earthobservatory.nasa.gov/IOTD/view.php?id=78869&eocn=image&eoci=related_image.
[32] M. D. Flannigan, M. A. Krawchuk, W. J. de Groot, B. M. Wotton, and L. M. Gowman, “Implications of Changing Climate for Global Wildland Fire,” International Journal of Wildland Fire 18, no. 5 (2009): 483, http://media.eurekalert.org/aaasnewsroom/2010/FIL_000000000420/flannigan%20et%20al%202009%20%28climate%20change%20global%20wildland%20fire%29.pdf.
[33] C. B. Field, V. R. Barros, K. J. Mach, M. D. Mastrandrea, M. van Aalst, W. N. Adger, D. J. Arent, et al., “Technical Summary,” in Climate Change 2014: Impacts, Adaptation, and Vulnerability. Part A: Global and Sectoral Aspects. Contribution of Working Group II to the Fifth Assessment Report of the Intergovernmental Panel on Climate Change, ed. C. B. Field, V. R. Barros, D. J. Dokken, K. J. Mach, M. D. Mastrandrea, T. E. Bilir, M. Chatterjee, et al. (Cambridge and New York: Cambridge University Press, 2014), 35–94, http://www.ipcc.ch/pdf/assessment-report/ar5/wg2/WGIIAR5-TS_FINAL.pdf.
[34] World Bank, Turn Down the Heat: Why a 4°C Warmer World Must be Avoided (Washington, DC: World Bank, 2012), https://openknowledge.worldbank.org/handle/10986/11860.
[35] NASA Earth Observatory, “Fires and Smoke in Russia August 5,” 2010, http://earthobservatory.nasa.gov/IOTD/view.php?id=45046.
[36] B. Jongman, P. J. Ward, and J. C. J. H. Aerts, “Global Exposure to River and Coastal Flooding: Long Term Trends and Changes,” Global Environmental Change 22, no. 4 (October 2012): 823–35, http://www.sciencedirect.com/science/article/pii/S0959378012000830.
[37] S. Hanson, R. J. Nicholls, N. Ranger, S. Hallegatte, J. Corfee-Morlot, C. Herweijer, and J. Chateau, “A Global Ranking of Port Cities with High Exposure to Climate Extremes,” Climate Change 104, no. 1 (December 2011): 89–111, http://link.springer.com/article/10.1007%2Fs10584-010-9977-4.
[38] World Bank, World Development Indicators Database, 2015, http://data.worldbank.org/data-catalog/world-development-indicators.
[39] B. Güneralp, İ. Güneralp, and Y. Liu, “Changing Global Patterns of Urban Exposure to Flood and Drought Hazards,” Global Environmental Change 31 (March 2015): 217–25, http://www.sciencedirect.com/science/article/pii/S0959378015000047.
[40] H. C. Winsemius, L. P. H. Van Beek, B. Jongman, P. J. Ward, and A. Bouwman, “A Framework for Global River Flood Risk Assessments,” Hydrology and Earth System Sciences 17, no. 5 (May 2013): 1871–92, http://www.hydrol-earth-syst-sci.net/17/1871/2013/.
[41] N. W. Arnell and B. Lloyd-Hughes, “The Global-scale Impacts of Climate Change on Water Resources and Flooding under New Climate and Socio-economic Scenarios,” Climate Change 122, no. 1–2 (November 2014): 127–40, http://link.springer.com/10.1007/s10584-013-0948-4.
[42] NOAA National Centers for Environmental Information, “Earth Observation Group (EOG),” 2015, http://ngdc.noaa.gov/eog/index.html.
[43] S. L. Cutter, B. J. Boruff, and W. L. Shirley, “Social Vulnerability to Environmental Hazards,” Social Science Quarterly 84, no. 2 (2003): 242–61, http://www.colorado.edu/hazards/resources/socy4037/Cutter%20%20%20Social%20vulnerability%20to%20environmental%20hazards.pdf.
[44] R. Mechler and L. M. Bouwer, “Understanding Trends and Projections of Disaster Losses and Climate Change: Is Vulnerability the Missing Link?,” Climate Change (2014): 1–13, http://dx.doi.org/10.1007/s10584-014-1141-0.
[45] J. Birkmann, “First- and Second-order Adaptation to Natural Hazards and Extreme Events in the Context of Climate Change,” Natural Hazards 58, no. 2 (2011): 811–40, http://link.springer.com/article/10.1007%2Fs11069-011-9806-8#page-1.
[46] D. Lallemant, S. Wong, and A. Kiremidjian, “A Framework for Modelling Future Urban Disaster Risk,” in Understanding Risk in an Evolving World—Emerging Best Practices in Natural Disaster Risk Assessment (Washington DC: World Bank, 2014), 191–96, http://www.worldbank.org/content/dam/Worldbank/FeatureStory/japan/pdf/101414_event/Understanding_Risk-Web_Version-rev_1.8.0.pdf
[47] J. King, “Early Results from Savda Ghevra Field Work, Delhi,” Incremental Housing (website), 2011, http://web.mit.edu/incrementalhousing/articlesPhotographs/index.html.
[48] Global Facility for Disaster Reduction and Recovery, Understanding Risk in an Evolving World: Emerging Best Practices in Natural Disaster Risk Assessment (Washington, DC: World Bank, 2014). https://www.gfdrr.org/sites/default/files/publication/Understanding_Risk-Web_Version-rev_1.8.0.pdf.
[49] Global Facility for Disaster Reduction and Recovery, Understanding Risk: Review of Open Source and Open Access Software Packages Available to Quantify Risk from Natural Hazards (Washington, DC: World Bank, 2014).
[50] L. M. Bouwer, “Projections of Future Extreme Weather Losses Under Changes in Climate and Exposure,” Risk Analysis 33, no. 5 (2013): 915–30. doi:10.1111/j.1539-6924.2012.01880.x.
[51] Y. Budiyono, J. C. J. H. Aerts, D. Tollenaar, and P. Ward, “River Flood Risk in Jakarta under Scenarios of Future Change,” Natural Hazards and Earth System Sciences Discussions 3, no. 7 (2015): 4435–78. doi:10.5194/nhessd-3-4435-2015.
[52] IPCC Data Distribution Centre, “Scenario Process for AR5, Representative Concentration Pathways,” May 1, 2014, http://sedac.ipcc-data.org/ddc/ar5_scenario_process/RCPs.html.
[53] J. Hinkel, D. Lincke, A. T. Vafeidis, M. Perrette, R. J. Nicholls, R. S. J. Tol, B. Marzeion, X. Fettweis, C. Ionescu, and A. Levermann, “Coastal Flood Damage and Adaptation Costs under 21st Century Sea-Level Rise,” Proceedings of the National Academy of Sciences of the United States of America 111, no. 9 (2014): 3292–97. doi:10.1073/pnas.1222469111.
[54] United Nations Office for Disaster Risk Reduction, Global Assessment Report on Disaster Risk Reduction 2011: Revealing Risk, Redefining Development (Geneva: UNISDR, 2011).
[55] See R. E. Kopp, M. Horton, C. M. Little, J. X. Mitrovica, M. Oppenheimer, D. J. Rasmussen, B. H. Strauss, and C. Tebaldi, “Probabilistic 21st and 22nd Century Sea-Level Projections at a Global Network of Tide Gauge Sites,” Earth's Future 2 (2014): 287–306, http://onlinelibrary.wiley.com/doi/10.1002/2014EF000239/full.
[56] See for example Risky Business Project, Risky Business: The Economic Risks of Climate Change in the United States, 2014, http://riskybusiness.org/uploads/files/RiskyBusiness_Report_WEB_09_08_14.pdf.
[57] C. Linard, M. Gilbert, A. E. Gaughan, F. R. Stevens, and A. J. Tatem, “Urban Expansion Forecasts and Changing Human Population Distribution in Africa,” paper presented at the Global Land Project Open Science Meeting, “Land Transformations: Between Global Challenges and Local Realities,” Berlin, March 19–21, 2014.
[58] B. C. O’Neill, E. Kriegler, K. Riahi, K. L. Ebi, S. Hallegatte, T. R. Carter, R. Mathur, and D. P. van Vuuren, “A New Scenario Framework for Climate Change Research: The Concept of Shared Socioeconomic Pathways,” Climate Change 122, no. 3 (October 2014): 387–400, http://link.springer.com/10.1007/s10584-013-0905-2.
[59] D. Lallemant, H. Burton, L. Ceferino, Z. Bullock, and A. Kiremidjian (2015), “Changing Earthquake Vulnerability Linked to Informal Building Expansion,” in Making a Riskier Future: How Our Decisions Are Shaping Future Disaster Risk (Washington DC: World Bank, forthcoming).
[60] S. Hallegatte, Natural Disasters and Climate Change: An Economic Perspective (Cham, Switzerland: Springer, 2014), http://link.springer.com/book/10.1007/978-3-319-08933-1.
[61] Intergovernmental Panel on Climate Change, “Summary for Policymakers,” in Climate Change 2014: Mitigation of Climate Change. Contribution of Working Group III to the Fifth Assessment Report of the Intergovernmental Panel on Climate Change, ed. O. Edenhofer, R. Pich-Madruga, Y. Sokona, E. Farahani, S. Kadner, K. Seyboth, A. Adler, et al. (Cambridge and New York: Cambridge University Press), 1–31,http://www.ipcc.ch/pdf/assessment-report/ar5/wg3/ipcc_wg3_ar5_summary-for-policymakers.pdf.
[62] Organisation for Economic Co-operation and Development, “Climate Change Mitigation: What Do We Do?” 2008, http://www.oecd.org/env/cc/41751042.pdf.
[63] Food and Agriculture Organization, Climate-Smart Agriculture Sourcebook, 2013, http://www.fao.org/docrep/018/i3325e/i3325e.pdf.
[64] J. A. Church, P. U. Clark, A. Cazenave, J. M. Gregory, S. Jevrejeva, A. Levermann, G. A. Merrifield, et al., “Sea Level Change,” in Climate Change 2013: The Physical Science Basis. Contribution of Working Group I to the Fifth Assessment Report of the Intergovernmental Panel on Climate Change, ed. T. F. Stocker, D. Qin, G.-K. Plattner, M. Tignor, S. K. Allen, J. Boschung, A. Nauels, Y. Xia, V. Bex, and P. M. Midgley (Cambridge and New York: Cambridge University Press, 2013), 1137–1216, http://www.ipcc.ch/pdf/assessment-report/ar5/wg1/WG1AR5_Chapter13_FINAL.pdf.
[65] susdrain, “SuDS Management Train,” 2012, http://www.susdrain.org/delivering-suds/using-suds/suds-principles/management-train.html..
[66] N. Phien-wej, P. H. Giao, and P. Nutalaya, “Land Subsidence in Bangkok, Thailand,” Engineering Geology 82, no. 4 (February 2006): 187–201, http://www.sciencedirect.com/science/article/pii/S0013795205002693.
[67] International Federation of Red Cross and Red Crescent Societies, Sustainable Reconstruction in Urban Areas: A Handbook, 2012, https://www.ifrc.org/PageFiles/95526/publications/Urban%20reconstruction%20Handbook%20IFRC-SKAT.pdf.
[68] O. Edenhofer, R. Pichs-Madruga, Y. Sokona, S. Kadner, J. C. Minx, S. Brunner, S. Agrawala, et al., “Technical Summary,” in Climate Change 2014: Mitigation of Climate Change. Contribution of Working Group III to the Fifth Assessment Report of the Intergovernmental Panel on Climate Change, ed. O. Edenhofer, R. Pichs-Madruga, Y. Sokona, E. Farahani, S. Kadner, K. Seyboth, A. Adler, et al. (Cambridge and New York: Cambridge University Press, 2014), http://www.ipcc.ch/pdf/assessment-report/ar5/wg3/ipcc_wg3_ar5_technical-summary.pdf.
[69] C. Wang, “Regulating Land Development in a Natural Disaster-Prone Area: The Roles of Building Codes,” Resource and Energy Economics 36, no. 1 (January 2014): 209–28, http://www.sciencedirect.com/science/article/pii/S0928765512000632.
[70] N. Saito, “Challenges for Adapting Bangkok’s Flood Management Systems to Climate Change,” Urban Climate 9 (September 2014): 89–100, http://www.sciencedirect.com/science/article/pii/S2212095514000534.
[71] S. B. Manyena, G. O’Brien, P. O’Keefe, and J. Rose, “Disaster Resilience: A Bounce Back or Bounce Forward Ability?,” Local Environment 16, no. 5 (2011): 417–24, http://dx.doi.org/10.1080/13549839.2011.583049.
[72] S. L. Cutter, K. D. Ash, and C. T. Emrich, “The Geographies of Community Disaster Resilience,” Global Environmental Change 29 (November 2014): 65–77, http://www.sciencedirect.com/science/article/pii/S0959378014001459.
[73] B. K. van Wesenbeeck, J. P. M. Mulder, M. Marchand, D. J. Reed, M. B. de Vries, H. J. de Vriend, and P. M. J. Herman, “Damming Deltas: A Practice of the Past? Towards Nature-Based Flood Defenses,” Estuarine, Coastal and Shelf Science 140 (2014): 1–6, http://www.sciencedirect.com/science/article/pii/S0272771413005556.
[74] Royal Society, Resilience to Extreme Weather (London: Royal Society, 2014), https://royalsociety.org/policy/projects/resilience-extreme-weather/.
[75] B. K. van Wesenbeeck, “Nature-based Coastal Defences: Can Biodiversity Help?,” in Encyclopedia of Biodiversity, 2nd ed. (Amsterdam: Academic Press, 2013), 451–58, http://www.sciencedirect.com/science/referenceworks/9780123847201.
[76] M. Duncan, S. Edwards, C. Kilburn, J. Twigg, and K. Crowley, “An Interrelated Hazards Approach to Anticipating Evolving Risk,” in Making a Riskier Future: How Our Decisions Are Shaping Future Disaster Risk (Washington, DC: Global Facility for Disaster Reduction and Recovery and World Bank, forthcoming).