Applications: High-level understanding of a city’s potential future climate risks and impacts, in relation to its demographic and socioeconomic contexts
Data requirement: Global data with option to incorporate local data
Final deliverables: An interactive web platform or slide deck that utilizes very high-resolution (VHR) satellite imagery time series to analyze landcover characteristics and hazard exposure at a neighborhood level. The findings are presented as interactive and easy-to-understand maps and graphs, providing detailed insights into neighborhood-level environmental changes and hazard exposures.
Geographic scope: City-level
Hazards covered: Future projections of climate-induced risks and impacts
Indicative Cost / working time: $500 - $9k
Time Required for delivery: 2-3 weeks
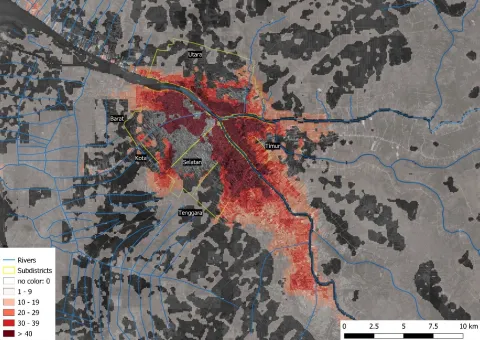
The City Neighborhood Scan uses very high-resolution (VHR) satellite imagery time series to understand the landcover characteristics and hazard exposure on a neighborhood level. Using machine learning, the analysis tracks landcover changes over several years and relate the changes to environmental conditions such as urban heat, greenery, and elevation. The data are presented as interactive and easy-to-understand maps and graphs.